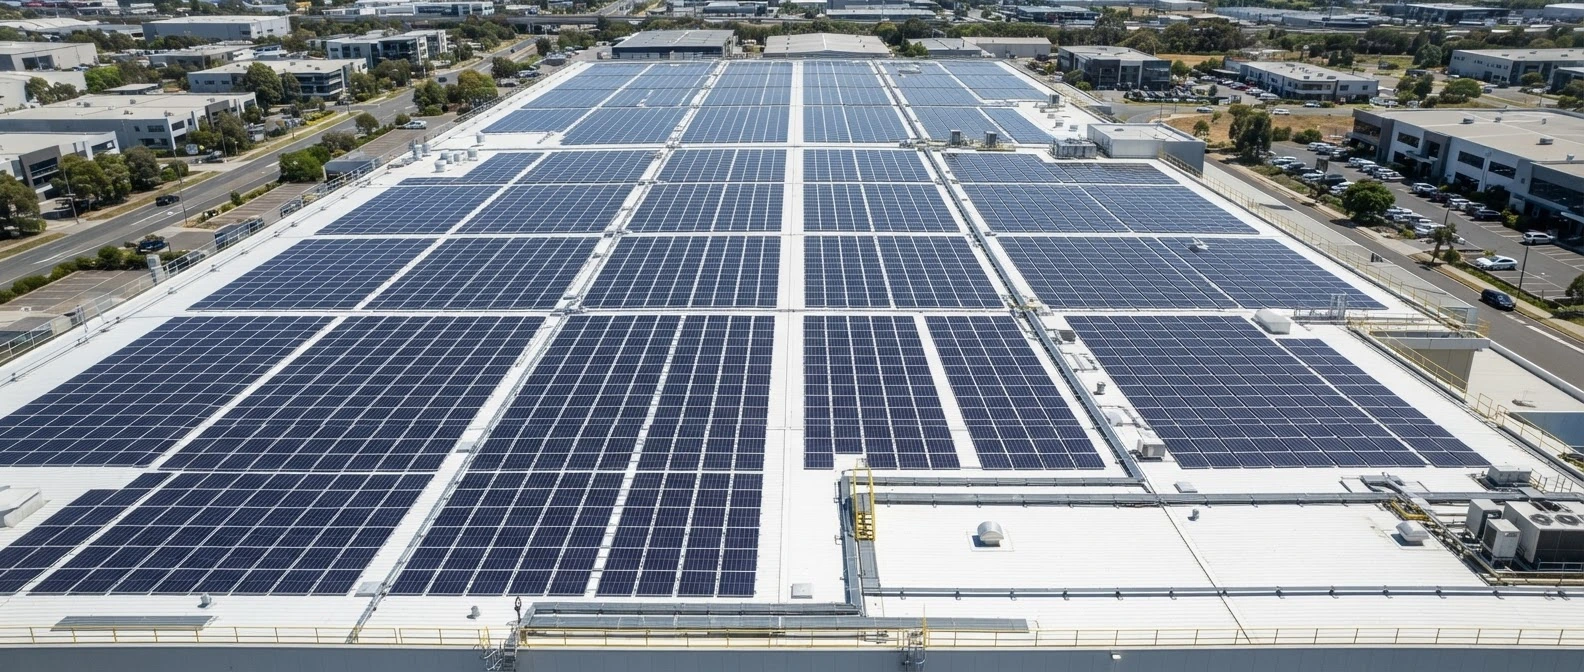
See how the energy model evolves with better evidence.
Simulate operating scenarios, test tariff and outage cases, and compare proposed behaviour with measured operation, using a model that improves as real data arrives.
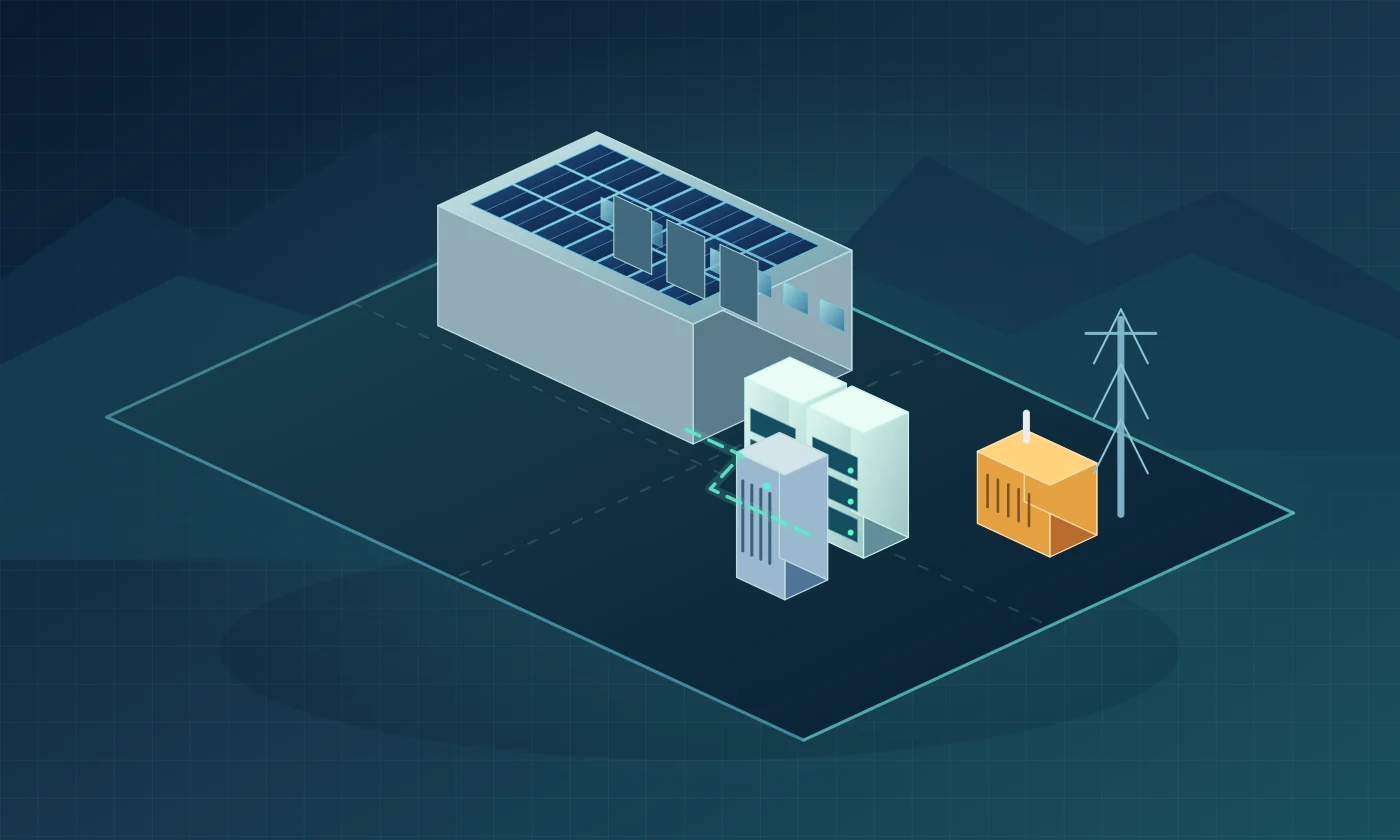
Proposed vs measured, on one timeline.
An illustrative twin of a commercial site. Switch operating modes, simulate an outage and inspect every hour. No live customer telemetry is shown.
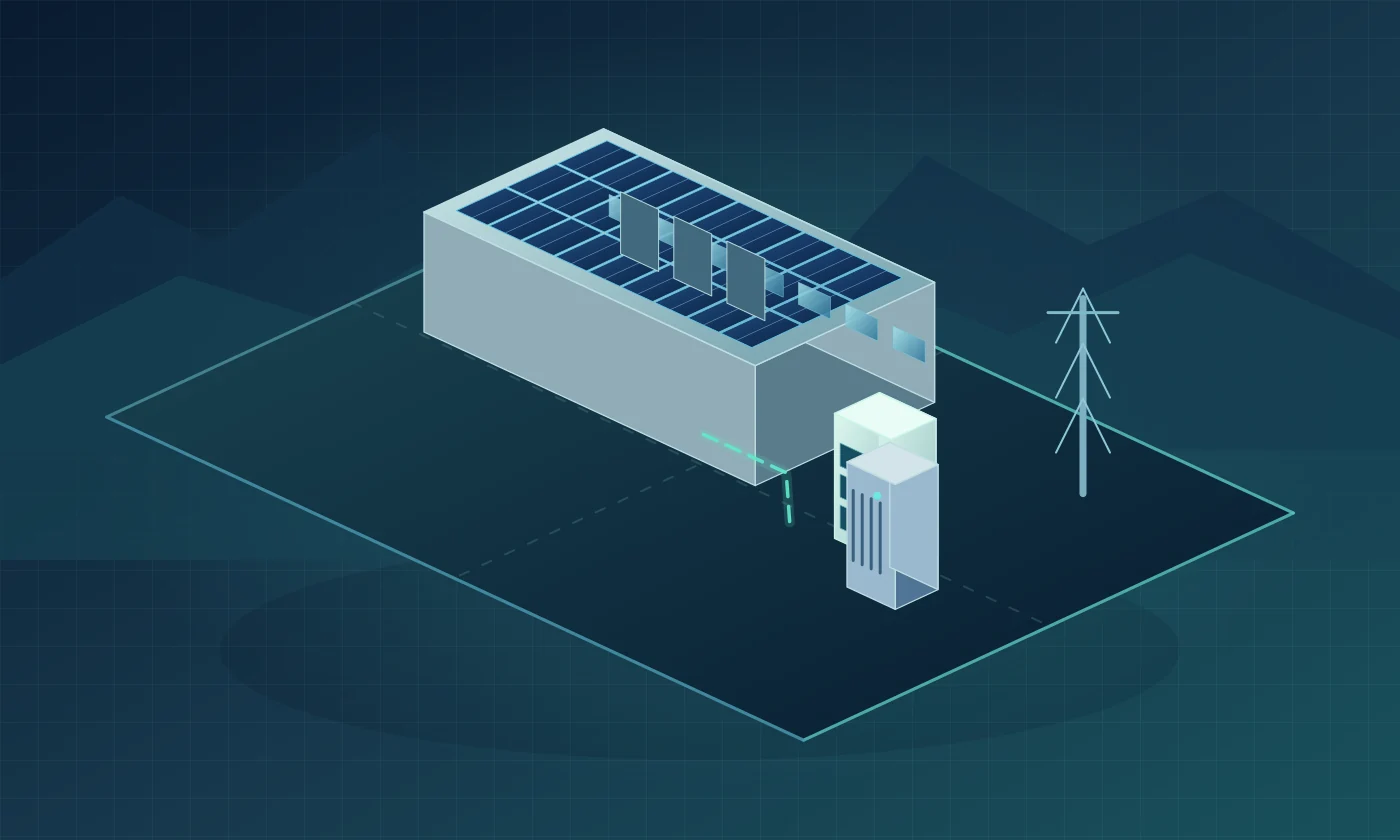
Illustrative twin. The site view and the graphs share one state: switch the scenario above and the graphs follow. No live customer telemetry is shown, and no figures are calculated here.
Each row is one piece of equipment; colour shows what it is doing. The EMS row shows the decision behind each change.
Supply always equals demand: solar first, then the battery in the windows the EMS chooses, then the grid. Charging appears below the axis. Shape from the illustrative model; real balance comes from metered data and the engineering model.
Left: solar only, no storage. Right: solar with battery and EMS. Same load, same sun; only the control changes. Shapes only, no savings implied.
What the twin is for.
Contrast layouts and battery sizes to find the practical limits.
Test outages and backup transitions safely before switching hardware.
Model load shifting when tariffs or seasons change.
Compare live logs with predictions to refine the next model.
Grid energy drawn in each tariff window and the highest demand of the day, before and after storage. Bars are relative to the no-storage case; actual tariffs and savings depend on the utility category and are calculated only from your bills.
Process, machines and power flow together.
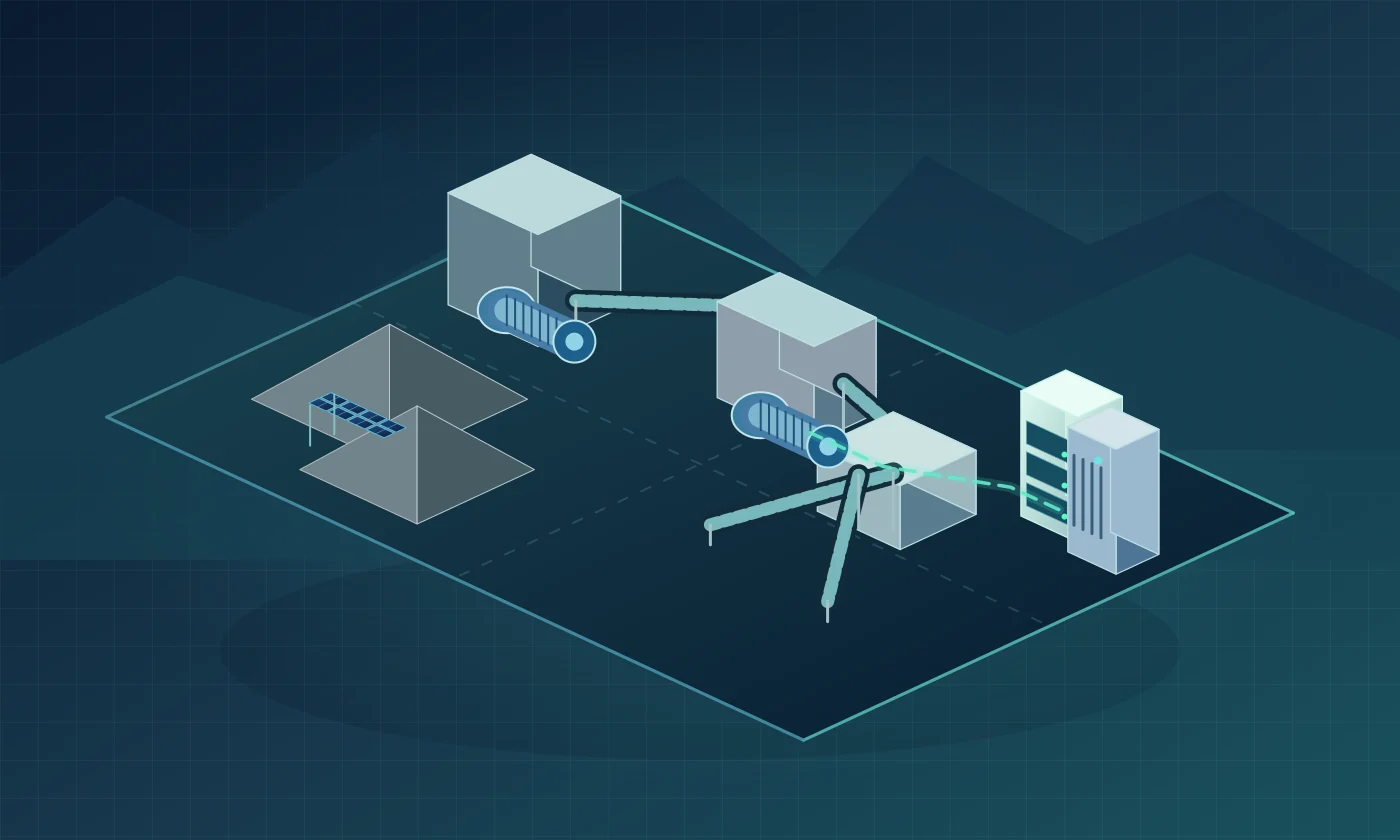
For industrial sites we are developing twin views that show the process, the machines, the power flow and the live state of PV, BESS and PCS in one picture, starting with stone crushers. The scene below is an illustrative preview of that direction, not a connected twin.
Start with how your site actually uses energy.
Share a few details and your recent bills. A Samvora engineer reviews your load, tariff and reliability needs before anything is proposed.